.
We have been asked for advice on how to read the trader rankings by people who are not sure about them.
I’m sure there are many people who don’t understand, so I’ll explain in the article ^^^
.
.
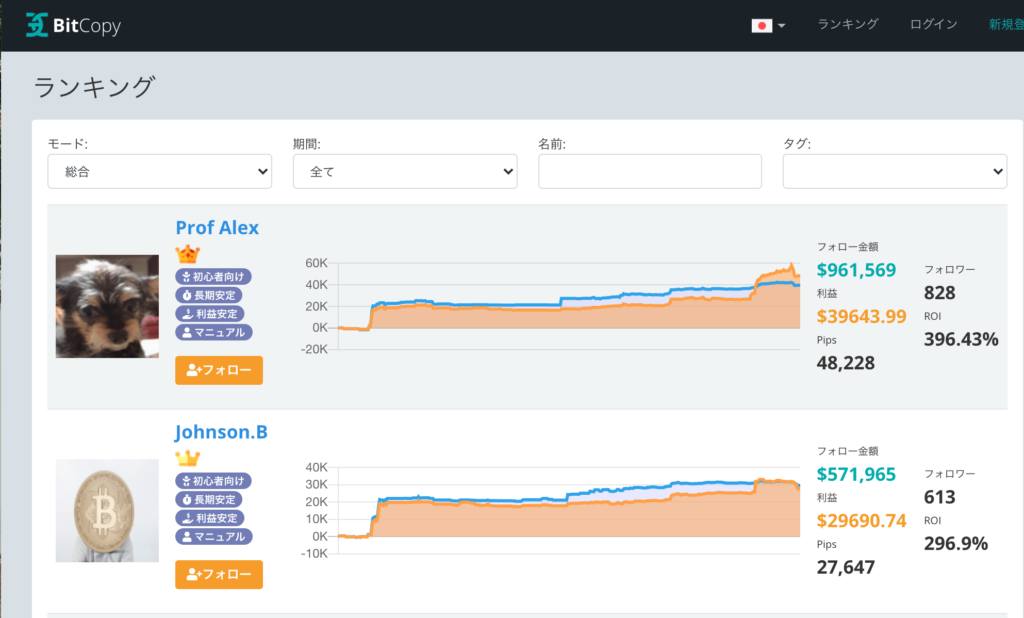
First open Trader Rankings.
.
For each trader, the following items are listed.
, amount of follow
, profit
, pips
, followers
and ROI
.
.
Follow Amount
This is the total follow assets of those who follow the trader.
.
and profit
The total profit and loss since the trader registered with BitCopy.
.
.
and Pips
This is the total number of pips since the trader registered with BitCopy.
Pips are the total number of pips since the trader registered a bitcopy.
.
Followers
The number of people who are currently following the trader.
.
・ROI
This is the return on investment.
This is the average of the profit margin of each trade.
.
.
.
.
When you look at these things, a trader with a large amount of followers and number of people to follow is a trader who is trusted by many people.
If the total profit so far is also positive and “steadily” increasing, we can be assured.
.
However, it is common to see traders with large profits and few losses, but be aware that when they do make losses, they can be quite large.
.
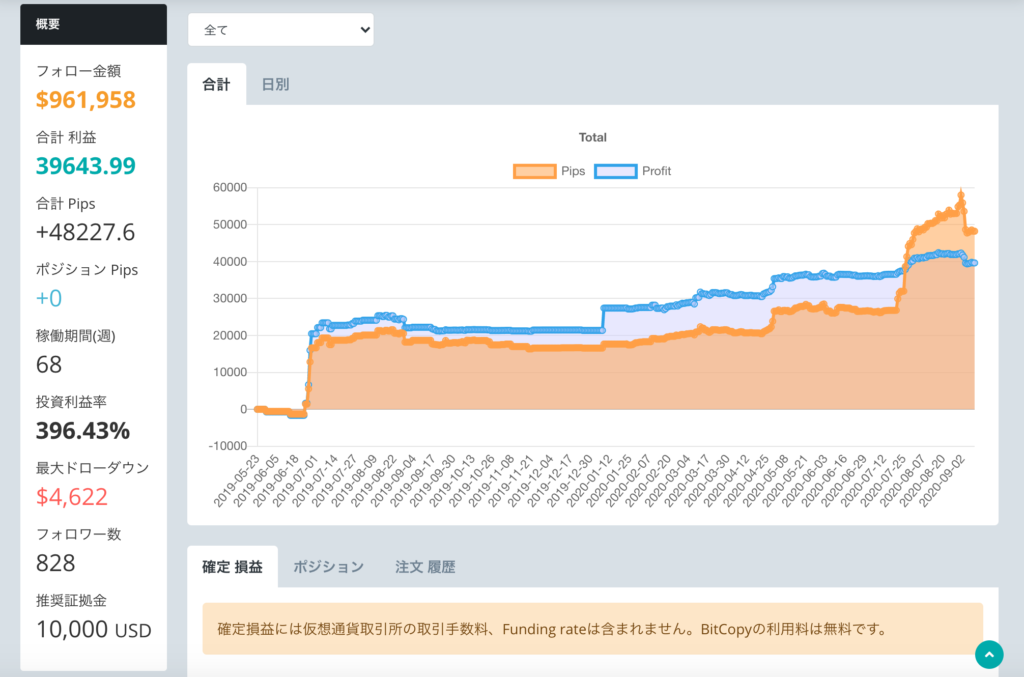
Now let’s go to the traders’ page.
Reference:Alex
https://bit-copy.com/en/trader /66
The following items appear in the overview on the left-hand side, which were not in the earlier list of traders.
.
– Position Pips
– Operation Period (weeks)
.
I’ll explain here as well.
-Position Pips
This is the number of pips in the position that the trader currently has.
When this is positive, the trader has an unrealized gain.
When it is negative, the trader has an unrealized gain or loss.
.
.
-Weekly
This is the period of time since the trader registered with BitCopy.
This is the length of time a trader has been trading with BitCopy, and the more stable and profitable a trader is, the more trustworthy they are.
This is the period of time that a trader has been up and running for a week.
.
.
Let’s take a look at the next large graph.
The total graph is the first one to appear.
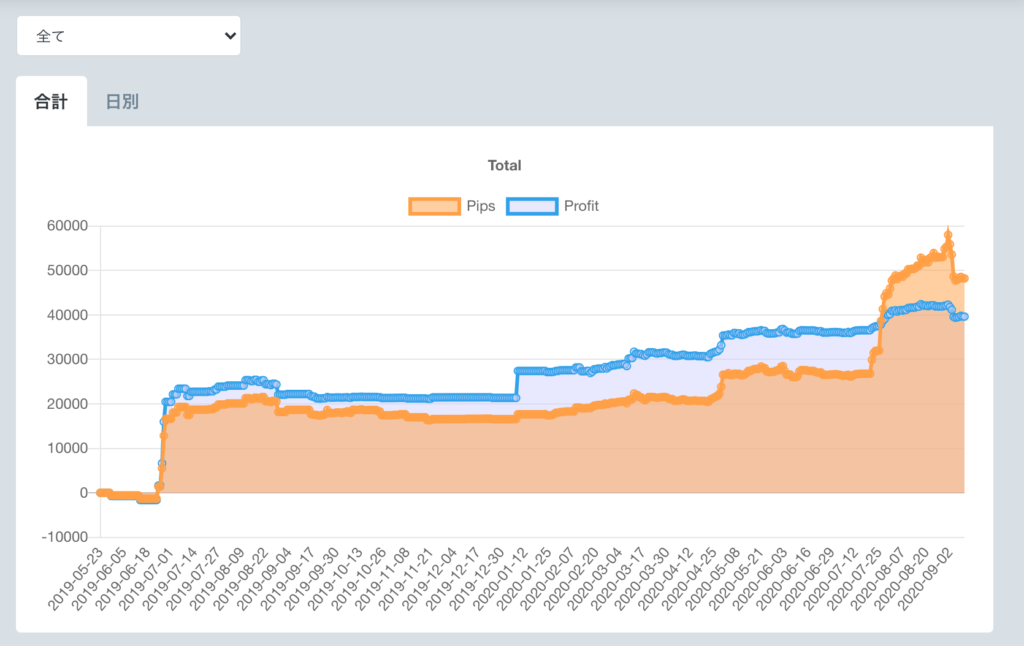
.
The graph shows the total profit and loss and the total number of pips.
When you see this graph, you can tell that a trader is accumulating profits.
This graph shows the total number of gains and pips.
.
.
What’s interesting is the graph by day.
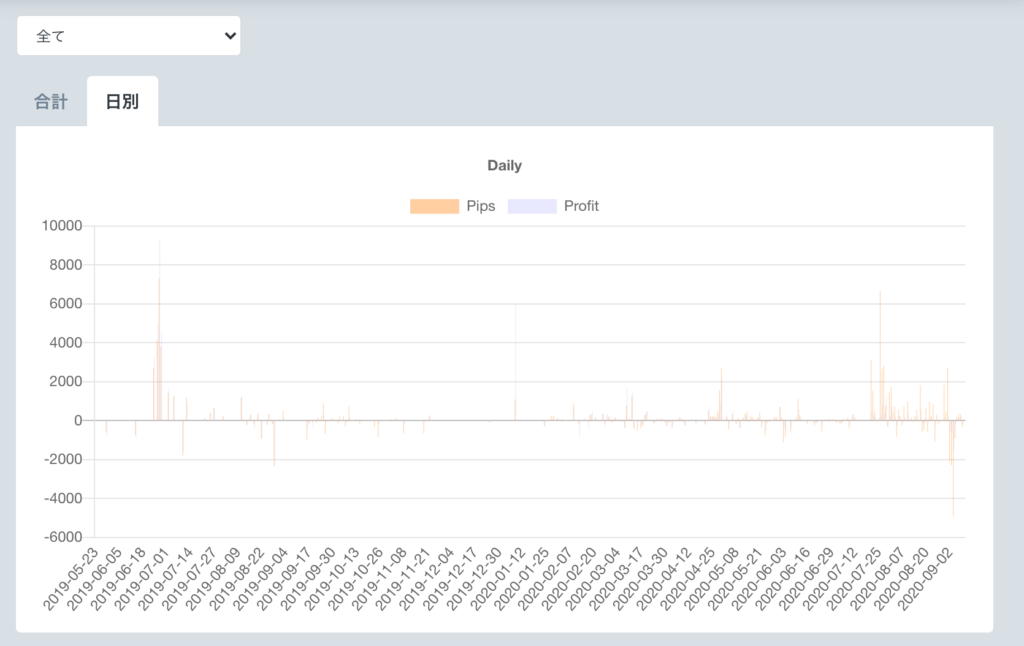
.
Even professional traders can confirm that there are days when they lose money.
No trader can be 100% sure of their predictions.
While the winning percentage is important, we believe that a trader with a positive profit and loss can be considered a reliable trader even if he or she is losing money, as shown in the picture below.
.
.
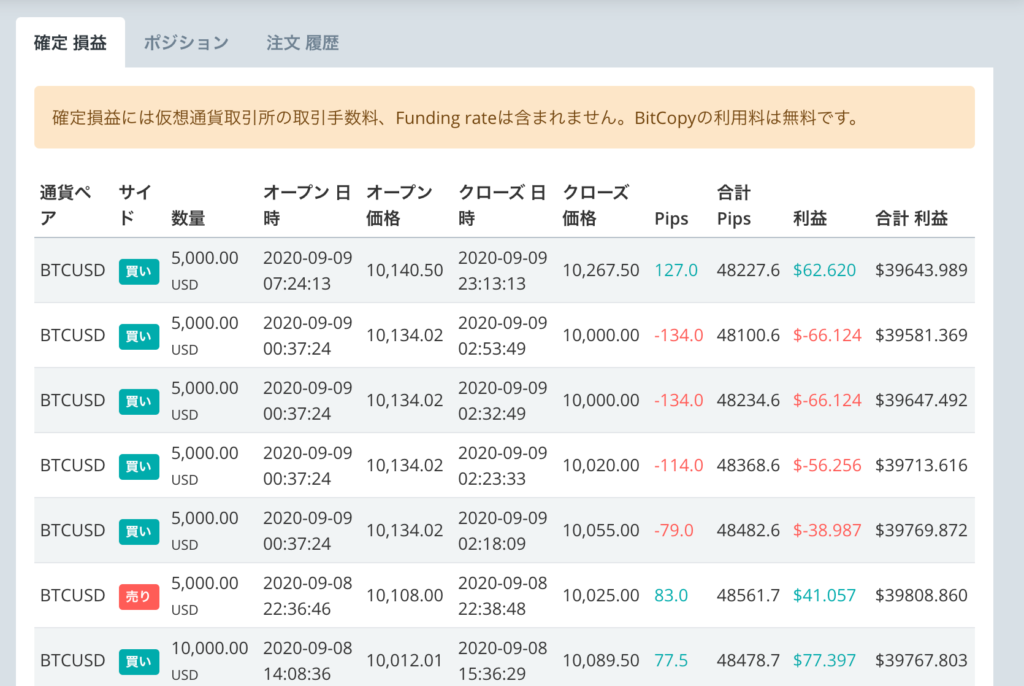
Scroll down to see the confirmed profit and loss.
.
You can see the actual profit and loss from each trade.
Here you can see how much profit a trader can make on a single trade.
Conversely, the amount of money you lose is also important.
This is where the so-called “gut feeling” traders can be judged.
These are the traders who are able to accumulate a steady stream of profits, but lose a lot of money.
That’s right.
.
.
We like traders who have more profits while making solid losses.
.
.
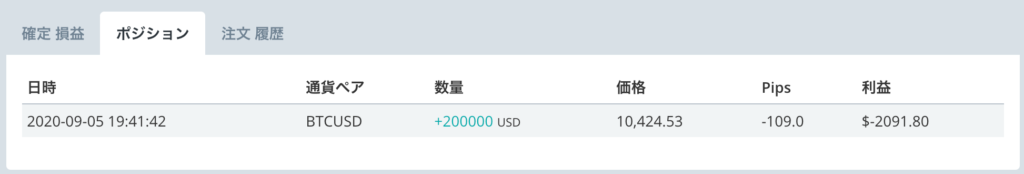
Let’s take a look at the next tab, Position.
.
If you have a current position, it will be displayed, otherwise it will be blank.
If you can’t see the position field, don’t worry, it will be reflected when the trader has a position. .
.
“Position” includes the following items.
, Date
, Date
, Currency Pair
, Volume
, Price
, Pips
and Profit
.
.
, Date and Time
This is the date and time when the position was held.
.
It is listed as the currency pair
BTCUSD, but we are not releasing any other services at this time.
.
and quantity
+●● USD and so on.
This is the number of positions the trader has in the market.
This quantity will change when you change the multiple.
This is the volume that the trader has.
.
, Price
It shows you at which price you took the position.
.
-Pips
Current number of pips is displayed.
.
and profit
Current profit or loss is shown.
.
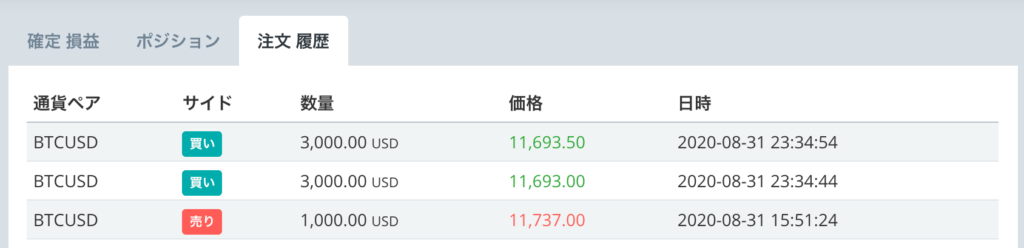
Let’s take a look at the order history section next!
, currency pair
, side
, volume
, price
, date and time
.
.
Currency pair
This will show BTCUSD as this is now a BTCUSD only release.
.
.
Side
It shows whether the position was a buy or sell position.
Sequence
It shows you the quantity of the position you ordered.
.
-Price
You will see the price at the time you ordered.
.
.
・Date and time
The date and time of the order are displayed.
.
.
You can find out what kind of trades a trader is doing by looking at his order history.
◆
Here’s an explanation of how to view the position situation you have.
After logging into Bybit
In the top left tab, select Inverse Unlimited.
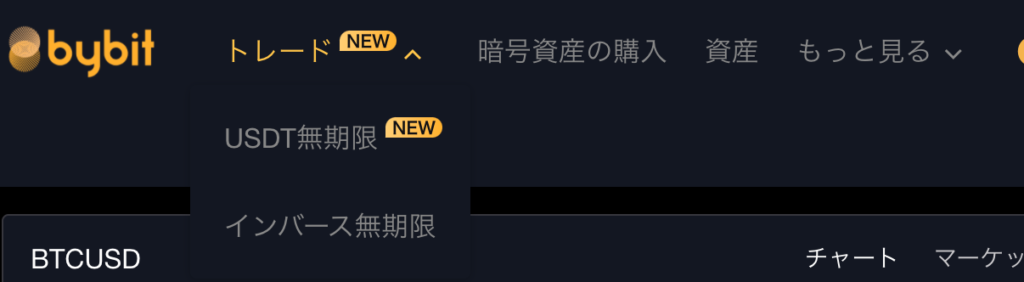
If you scroll down, the section labeled Position (BTCUSD) is the current position status.
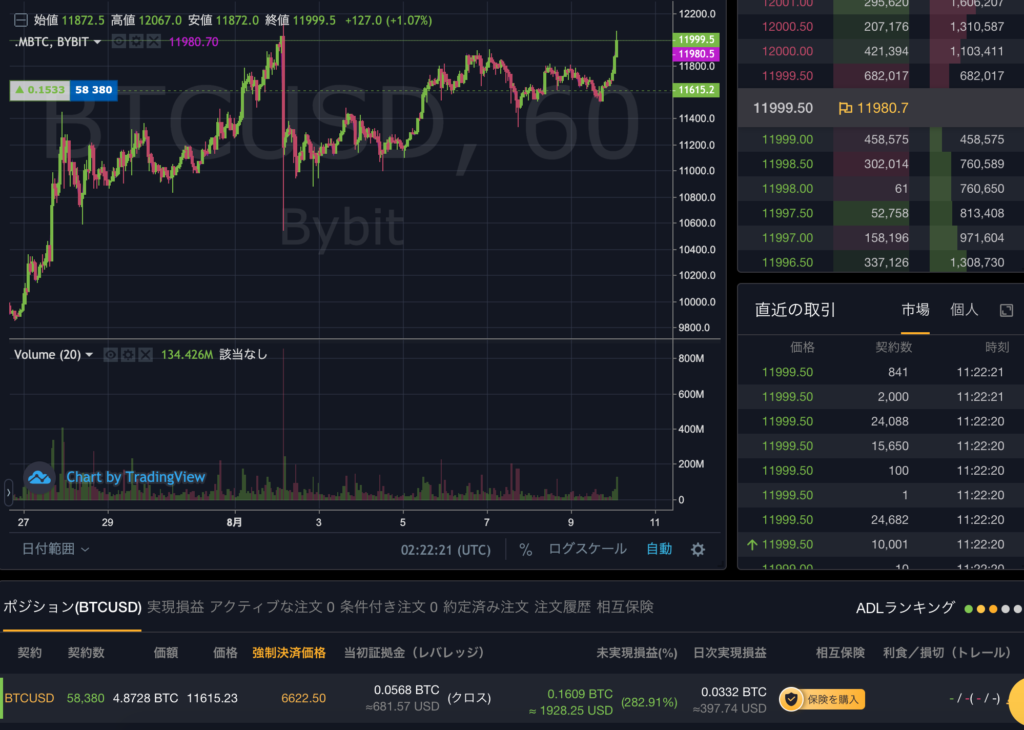
.
If you don’t see anything here, then you don’t have a position right now.
.
If you have a position, you will see the following
If you have a position, it will appear as follows
.
and contract
currency pairs are displayed. If you are operating in BitCopy, it will always be displayed as BTCUSD.
.
.
, Number of Contracts
The number of contracts and whether you are long (buy) or short (sell).
The number of contracts is shown in green if you buy, and in red if you sell.
. .
・Value
This is the estimated principal amount from the position. .
, Price
This is the price at which you took the position. .
Mandatory Settlement Price
This is the price for forced settlement (loss-cutting).
When the price reaches this level, a loss-cutting action will be taken.
.
.
・Initial Margin (Leverage)
This is the margin you use to open a position.
. .
Unrealized Gains and Losses
This page shows you the unrealized gain or loss on your current position in BTC and % in USD, with green indicating an unrealized gain or loss.
Green is for Unrealized Gains and red is for Unrealized Losses.
.
.
・Daily Realized Gains and Losses
Total Realized Gains and Losses as determined on the day are shown.
.
.
, Mutual Insurance
, Profit/Loss (Trailing), and Payment Order Method
The above three items are not used if you leave it to BitCopy.
.
.
.
Now let’s check the Realized Gains and Losses tab next to the Positions tab.
Next, let’s check the Realized P&L tab next to the Position tab.
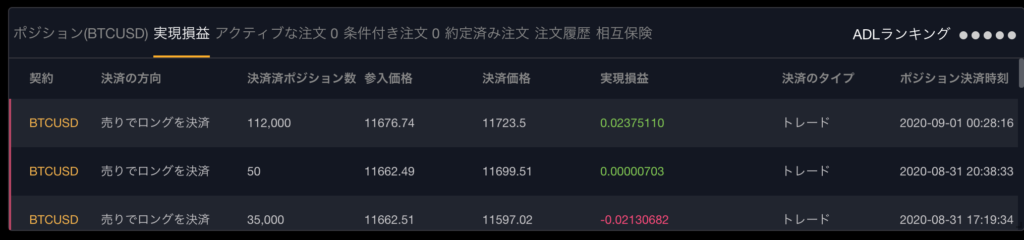
Details of the realized profit or loss at the time of settlement of each position will be displayed.
Contracts
This is a pair of BTCUSD.
The direction of settlement.
You will see either of the following
Sell to close long.
Buy and settle your shorts.
Number of closed positions
The number of positions closed at that time.
Entry price
The price at which the position was taken.
The price at which the position was held.
The price at which the position was closed.
Realized profit or loss
It is the profit and loss at the time of settlement.
Green means positive, red means negative.
Type of settlement
Except for loss-cutting, it is settled by trade, so it will be displayed as “Trade”.
Position settlement time
It’s time to close the position.
That was an explanation of how to look at bit copies and buy bits!
